

Weighting data has been applied on this dashboard. QLD and VIC have only data available for 2014.
PSC is a specific aspect of organisational climate, defined as “policies, practices, and procedures for worker psychological health and safety”. PSC is largely determined by management and leadership within organisations. The PSC construct has four main aspects that connect to best practice principles in the stress prevention, intervention, and safety climate literature.
- First is senior management support and commitment to psychological health through involvement and proactivity. This aspect is evident when senior management take quick and decisive action to address and correct issues that affect psychological health.
- Second is priority the management give to employee psychological health and safety versus productivity goals. For example, job demands (e.g., work pressure, emotional labour, physical demands) may be modified to make them more manageable, and management have the discretion to offer a variety of resources, such as work flexibility, autonomy, and social support that may buffer demands and reduce work stress.
- Third is organisational communication that concerns how the members of the organisation communicate about psychological health and safety, including identification of risks to mental health, strategies for risk control and hazard management.
- The final aspect, organisational participation concerns expectations for involvement from all levels within the organisation regarding stress prevention. It includes the integration of stakeholders such as employees, unions, and health and safety representatives in occupational (psychological) health and safety processes. (to read more click here)
Learn More
See more about the PSC benchmarks from the Australian Workplace Barometer (AWB) for the 2014-15 data collection.
Psychosocial Safety Climate Fact Sheet
Download Australian Workplace Barometer Psychology Safety Climate Factsheet (PSC) in "pdf" format
The different risk categories of PSC-12 according to the PSC Risk Benchmarks (Bailey et al., 2015; Dormann et al., 2017)

The following graph displays the PSC benchmarks from the Australian Workplace Barometer (AWB) for the 2021 data collection. To interact with the graph choose from the demographic variables (e.g., industry, state, gender, etc.) provided in the two demographic drop-down menus.
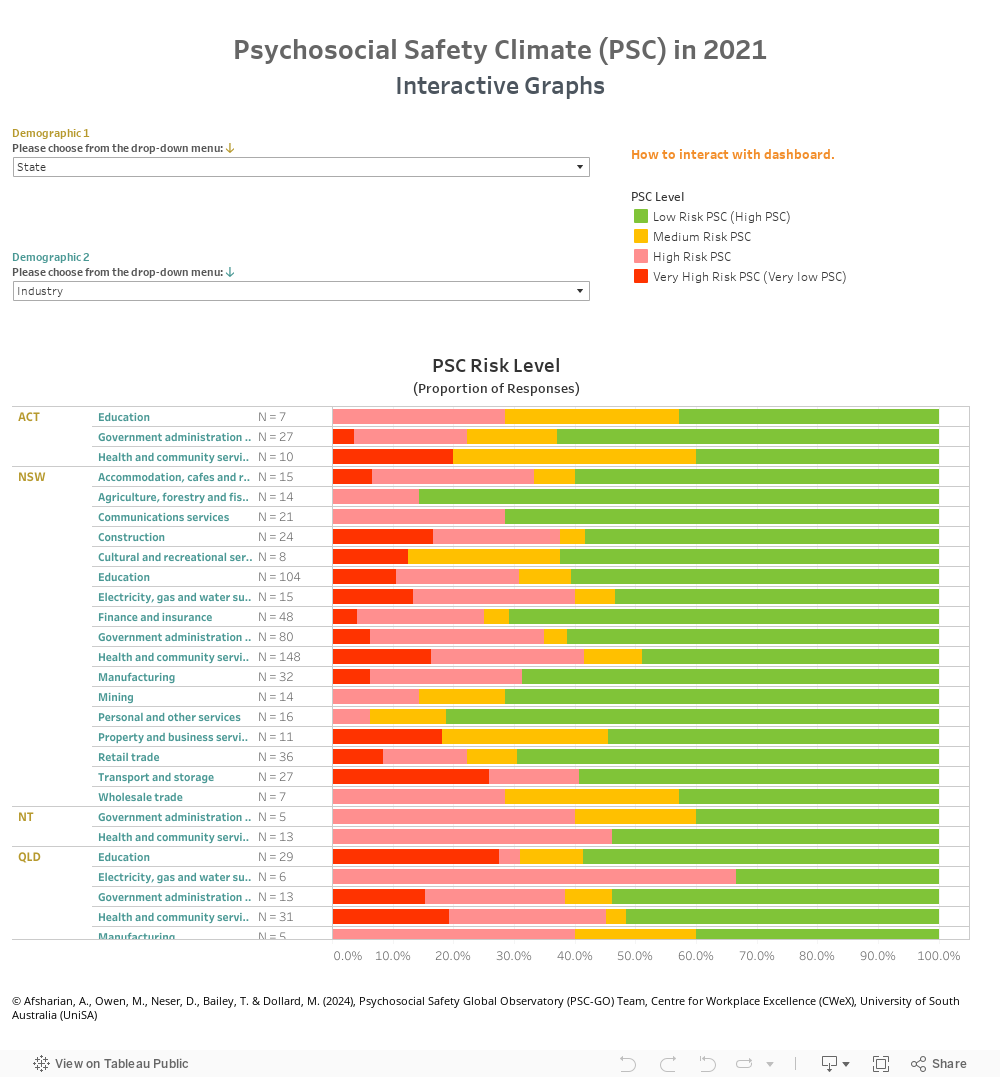
Our weights were developed based on demographic characteristics for the different states, and as such we present weighted data for the interactive dashboards that are broken down by state. Interactive dashboards that can be broken down into other characteristics (e.g., industry, occupation, etc.) are based on non-weighted data, as the state developed weights do not accurately reflect the characteristics of the groups of interest (e.g., the different industries, or the different occupations, etc.).
The above interactive dashboard displays the composition of workers in each of the PSC the risk categories for a variety of demographic measures. The results show the greatest proportion of workers reporting ‘Low Risk PSC’ are females in the transport and storage (90.9%) and males in cultural and recreational services (88.9%) industries. The greatest proportion of workers reporting ‘Very High Risk PSC’ are females in property and business services (22.2%) followed by males in transport and storage (20.4%) industries.
Results from the Australian Workplace Barometer – for more information go to AWB page.